
Football
Anatomy of a Touchdown
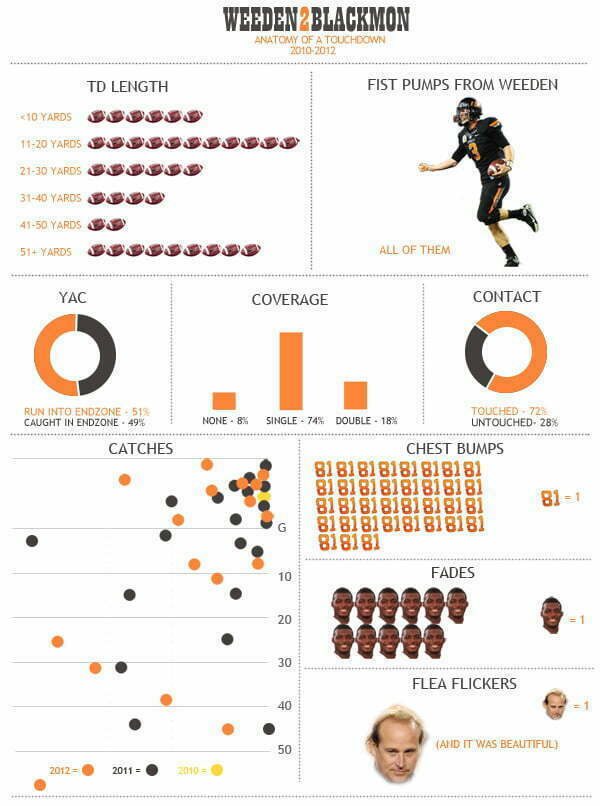
You saw all 39 of the Weeden2Blackmon TDs yesterday in the bullets, but here’s a little additional information on how those break down by yardage, where they were caught on the field, how many 81 ran in and how many he caught in the endzone, and how many times they went to the fade. Hope you enjoy!
Here’s a look at this infographic enlarged on Flickr if you’re having trouble seeing it on here.


Football11 hours ago
Report: Big 12 ADs Have ‘Serious’ Talks about Not Playing Texas Tech Following Sorsby Ruling

Football4 days ago
Oklahoma State Has the Big 12’s Best Trio of Offensive Superstars

#okstate5 days ago
1945 vs. 1988: What Was the Greatest Year in Oklahoma State Athletics History?

Football1 day ago
Three-Star Offensive Lineman Chase Clark Commits to Oklahoma State

Football2 days ago
Oklahoma State Flips Three-Star Offensive Lineman Sonny Mullen from Houston

Softball3 hours ago
Ruby Meylan Named to OKC Spark Reserve Pool Roster
Football11 hours ago
Report: Big 12 ADs Have ‘Serious’ Talks about Not Playing Texas Tech Following Sorsby Ruling

Football13 hours ago
Sorsby’s Temporary Injunction the Latest Example of How Broken College Athletics Is

Daily Bullets20 hours ago
Daily Bullets (June 8): Cowboys Land Two Commits, Long-Tenured Coaches Becoming More Rare

Football1 day ago
Big 12 Football: Are Long-Tenured College Football Coaches Going Extinct?
-
 Football11 hours ago
Report: Big 12 ADs Have ‘Serious’ Talks about Not Playing Texas Tech Following Sorsby Ruling
-
 Football4 days ago
Oklahoma State Has the Big 12’s Best Trio of Offensive Superstars
-
 #okstate5 days ago
1945 vs. 1988: What Was the Greatest Year in Oklahoma State Athletics History?
-
 Football1 day ago
Three-Star Offensive Lineman Chase Clark Commits to Oklahoma State