
Football
Recruiting rankings vs. overall success

Photo Attribution: US Presswire
I can’t think of two things college football fans argue more about than recruiting rankings and end-of-season team rankings. Sounds like a good starting point for a post.
This one is right up the @osustats alley. Here’s the data we started with:
Team Rankings: we used F/+ for this because it goes far beyond the top 20…the joint system of Brian Fremeau and Bill Connelly ranks programs 1-120. We’ve covered this system before.
Recruiting Rankings: we used the Rivals recruiting rankings. Yes, others are available but these are probably as good or better than any recruiting rankings out there.
We compared the average of the four recruiting classes leading up to a season against the end-of-season F/+ ranking for each team. Let’s look at OSU’s 2012 season as an example. For the season that just ended, here are the four recruiting classes we looked at:
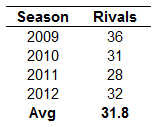
So, the four recruiting classes that contributed to the talent on the field for OSU’s 2012 season had an average ranking of 32. If recruiting rankings were all that mattered, OSU should have a final F/+ ranking of somewhere around 32, right? Well, we finished the season ranked at #12 in the F/+ system. In other words, we overachieved by 20 spots.
Now, is this perfect? No. Is there a perfect way to do this? No, but please feel free to write in the comments how you would have done it differently.
First, let’s take a look at a scatter plot of all teams from 2008 to current and how recruiting rankings correlate to final F/+ rankings:
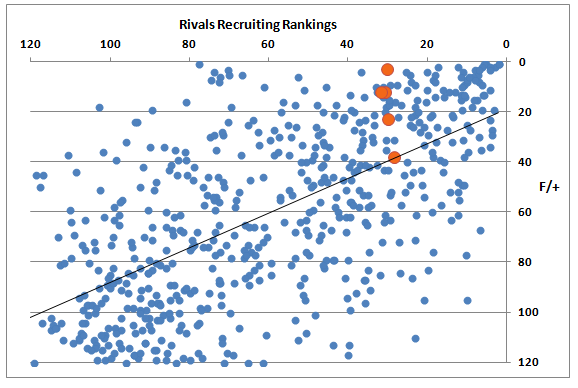
Okay, let’s break this down. Each of those 590 dots represents a college football team from 2008 to 2012 (five seasons). They are plotted on the graph this way: the average of the last four Rivals recruiting rankings is on the X-axis and the final F/+ ranking is on the Y-axis. You want to be up at the top right, where your team’s recruiting ranking is high and your F/+ ranking is high.
The trendline running through the data is the closest fit to each dot. The coefficient of determination is .42, meaning that based on this data, recruiting “explains” 42% of a team’s final rankings. Now, you could certainly argue with that figure. You could say we shouldn’t use a simple average of the team’s last four classes. You could say we shouldn’t use Rivals or F/+. There are all kinds of ways to attack this, and we recognize that. This is more a conversation starter than a conversation ender, so let’s just have fun with it.
Think about this…recruiting is just one variable that goes into a team’s success. It might be the single most important variable, but throw in coaching, player development, character, injuries, transfers in & out, class, and girlfriends, and it’s no wonder that recruiting only accounts for 42% of a team’s success.
All of that said, let’s get back to the chart. I said before that you want to be at the top right. But once a recruiting class is complete, you can’t change where you are on the X-axis. All you can do is develop and coach your players to the top of the Y-axis. So once signing day comes and goes, you want to get your team above the trendline that runs through the chart…you want to overachieve your recruiting ranking.
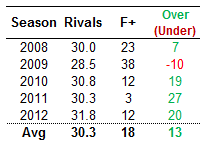
Mike Gundy and OSU have managed to do that in 4 out of the last 5 seasons:
In 2008, we were better than our recruiting classes by 7 spots. In 2009, we finished up 10 spots lower (mostly due to Zac & Kendall getting hurt and Dez getting suspended). But in each of the last three years, OSU has overachieved our recruiting classes by 19 or more spots per year. In 2011, Rivals said our talent level was around 30th-best in the country. We finished 3rd.
As Gundy said, “We take a two-star and make him a three, a three and make him a four and a four and make him a five. We really believe that’s what we do.”
The orange spots on the chart are OSU’s five seasons from 2008 to 2012. All are close to or above the trendline, which is where you want to be as a coaching staff.
Enough about us. Let’s take a look at the other teams in the Big 12. Teams are listed in order of overachievers to underachievers. OSU would be second in this list but you’ve already seen our figures.

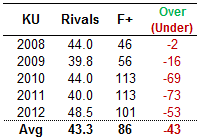
Poor Kansas. They even lost to Texas in underachieving.
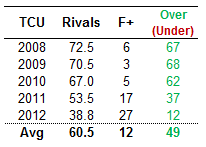
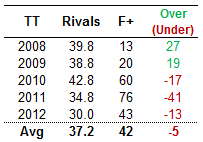
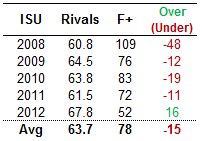
A few thoughts here. TCU has steadily climbed in recruiting rankings over the last five years. They can’t continue to overachieve their classes to the extent that have in the past, but clearly they know what they are doing down there.
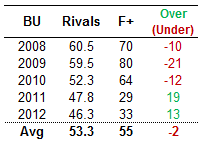
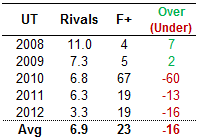
West Virginia’s figures look very similar to ours with the exception of what turned out to be a miserable 2012 season for them.
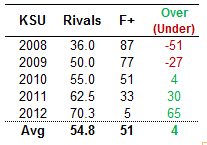
How about Snyder taking top 70 level talent to a 5th-place F/+ finish.
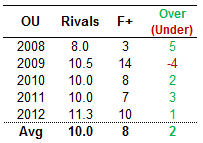
For all of the bellyaching in Norman, Stoops has performed about as well as he’s been recruiting — which is very well. He almost always turns in a top 10 class and a top 10 finish. Most anyone would be happy with that.
Skipping down to Texas, they really haven’t been horrible over the last two seasons, it’s just that with the pick of the litter in Texas and elite recruiting classes every year, you need to be in the top 10 at the end of the year on a consistent basis.
Kansas: the only thing I’m puzzled by is Kansas getting top 50 classes.
Nationally, here are the BCS programs that overachieved in all five seasons in this study (I am not including the Big East in this group): just TCU and Oregon. Boise State and Tulsa also achieved this feat.
OSU and West Virginia are in the 4 out of 5 club, along with Wisconsin, Stanford, Iowa, Oregon State, and Michigan State.
How about the schools that underachieved all five years? Florida State, Duke, USC, Arizona State, Cal, Virginia, Washington State, Tennessee, Washington, UCLA, and Colorado are in this club.
The Top 10 overachievers are:
1) Boise – overachieved by 64 spots
2) Navy – 51
3) TCU – 49
4) Northern Illinois – 47
5) Air Force – 42
6) Cincinnati – 41
7) Nevada – 36
8) Connecticut – 31
9) Wisconsin – 29
9) Bowling Green – 29
OSU is 30th in this list at 13 spots.
The Top 10 underachievers are:
10) Virginia – underachieved by 30 spots
9) Washington State – 31
8) Minnesota – 33
7) Tennessee – 34
6) Washington – 35
5) Auburn – 36 (and this includes a national championship!)
4) Maryland – 37
3) Kansas – 43
2) UCLA – 45
1) Colorado – 54


Report: Big 12 ADs Have ‘Serious’ Talks about Not Playing Texas Tech Following Sorsby Ruling

Oklahoma State Has the Big 12’s Best Trio of Offensive Superstars

1945 vs. 1988: What Was the Greatest Year in Oklahoma State Athletics History?

Three-Star Offensive Lineman Chase Clark Commits to Oklahoma State

Oklahoma State Flips Three-Star Offensive Lineman Sonny Mullen from Houston

Ruby Meylan Named to OKC Spark Reserve Pool Roster
Report: Big 12 ADs Have ‘Serious’ Talks about Not Playing Texas Tech Following Sorsby Ruling

Sorsby’s Temporary Injunction the Latest Example of How Broken College Athletics Is

Daily Bullets (June 8): Cowboys Land Two Commits, Long-Tenured Coaches Becoming More Rare

Big 12 Football: Are Long-Tenured College Football Coaches Going Extinct?
-
 Football14 hours ago
Report: Big 12 ADs Have ‘Serious’ Talks about Not Playing Texas Tech Following Sorsby Ruling
-
 Football4 days ago
Oklahoma State Has the Big 12’s Best Trio of Offensive Superstars
-
 #okstate5 days ago
1945 vs. 1988: What Was the Greatest Year in Oklahoma State Athletics History?
-
 Football2 days ago
Three-Star Offensive Lineman Chase Clark Commits to Oklahoma State