
Football
Which Big 12 Team Has Had the Worst QB Luck?
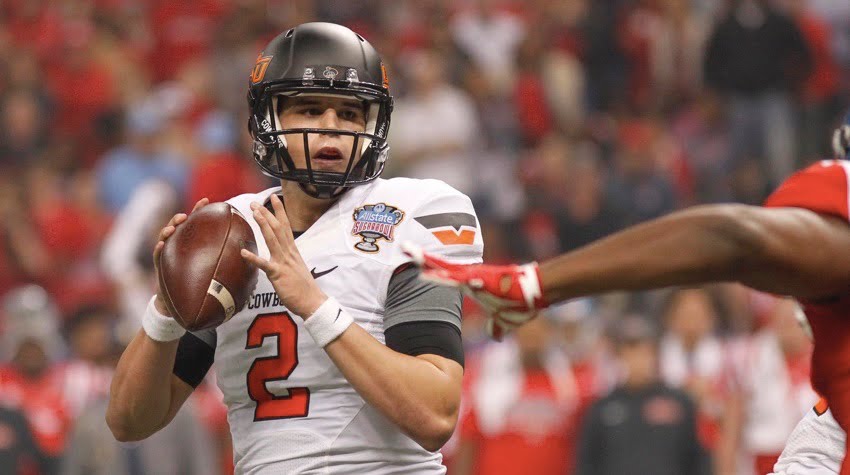
Oklahoma State fans know as well as maybe any program in the country that a good backup QB comes in handy. In 2012 injuries led to OSU starting three different quarterbacks throughout the season. In 2014 J.W. Walsh started the season against Florida State, then injured his foot in a win over Missouri State. Later in the year, a concussion knocked Daxx Garman out of his starting job and introduced the Rudolph era.
OSU isn’t alone, of course. Baylor played five different QBs last year. Kody Cook served as an emergency QB for Kansas State last year and led the Wildcats to four touchdown drives in the first half alone against OSU.
With so many teams in our conference dealing with QB carousels in recent years, I thought it would be interesting to see what Big 12 teams over the last five seasons have reached the farthest down their QB depth chart – whether by choice or necessity.
For this analysis, I pulled every passing attempt for Big 12 teams over the last five seasons. I did not include a player’s attempts if they had three or fewer attempts in a game – this was an attempt to weed out light mop-up duty and trick plays. The table below shows each team’s QB1 through QB5 in a given season.
The table is sorted by my calculation of how many QBs they used. As an example, if a team’s QB1 was used for every single play, their depth rating would be 1.0. If QB1 was used for 50% of team snaps and QB2 was used for 50%, their depth rating would be 2.0. If QB1 was used for 75% of snaps and QB2 was used for 25%, the depth rating would be 1.5. In this ranking, it matters more how many snaps were used by the 2nd or 3rd guy than how many QBs were used outright. Here’s the table.
| Team | QB1 | QB2 | QB3 | QB4 | QB5 | Deep |
|---|---|---|---|---|---|---|
| Oklahoma St – 2012 | 40.3% | 32.9% | 26.8% | – | – | 2.73 |
| Baylor – 2015 | 52.8% | 27.4% | 13.2% | 5.8% | 0.8% | 2.49 |
| West Virginia – 2013 | 50.0% | 36.4% | 13.6% | – | – | 2.27 |
| Texas – 2011 | 50.3% | 40.6% | 9.1% | – | – | 2.18 |
| Iowa St – 2012 | 59.4% | 23.2% | 17.4% | – | – | 2.16 |
| Texas Tech – 2013 | 50.9% | 48.0% | 1.1% | – | – | 2.00 |
| Iowa St – 2015 | 53.0% | 47.0% | – | – | – | 1.94 |
| Iowa St – 2013 | 53.2% | 46.8% | – | – | – | 1.94 |
| Iowa St – 2011 | 54.1% | 45.9% | – | – | – | 1.92 |
| Texas Tech – 2014 | 62.1% | 33.3% | 4.7% | – | – | 1.85 |
| TCU – 2013 | 57.6% | 42.4% | – | – | – | 1.85 |
| Oklahoma – 2013 | 61.4% | 35.2% | 3.4% | – | – | 1.84 |
| Oklahoma St – 2014 | 69.4% | 21.6% | 9.0% | – | – | 1.79 |
| Oklahoma St – 2013 | 60.7% | 39.3% | – | – | – | 1.79 |
| Kansas – 2015 | 70.0% | 23.5% | 5.1% | 1.3% | – | 1.76 |
| Texas – 2015 | 63.4% | 36.6% | – | – | – | 1.73 |
| Kansas – 2014 | 65.4% | 34.6% | – | – | – | 1.69 |
| Kansas – 2012 | 69.7% | 30.3% | – | – | – | 1.61 |
| TCU – 2012 | 73.6% | 24.6% | 1.8% | – | – | 1.56 |
| TCU – 2015 | 78.4% | 16.7% | 5.0% | – | – | 1.53 |
| Texas – 2013 | 76.6% | 20.4% | 3.0% | – | – | 1.53 |
| West Virginia – 2014 | 78.9% | 20.3% | 0.8% | – | – | 1.44 |
| Kansas – 2013 | 80.1% | 19.0% | 0.9% | – | – | 1.42 |
| Texas – 2012 | 80.9% | 19.1% | – | – | – | 1.38 |
| Kansas State – 2015 | 82.0% | 18.0% | – | – | – | 1.36 |
| BIG 12 MEDIAN | 1.35 | |||||
| Oklahoma St – 2015 | 83.5% | 15.6% | 1.0% | – | – | 1.35 |
| Baylor – 2014 | 83.3% | 16.1% | 0.6% | – | – | 1.35 |
| Oklahoma – 2014 | 83.6% | 16.4% | – | – | – | 1.33 |
| Kansas State – 2013 | 85.0% | 15.0% | – | – | – | 1.30 |
| Iowa St – 2014 | 89.3% | 10.7% | – | – | – | 1.21 |
| Baylor – 2013 | 90.4% | 9.6% | – | – | – | 1.19 |
| Oklahoma – 2015 | 91.2% | 8.8% | – | – | – | 1.18 |
| Texas – 2014 | 91.9% | 8.1% | – | – | – | 1.16 |
| Texas Tech – 2012 | 92.3% | 7.7% | – | – | – | 1.15 |
| TCU – 2014 | 94.4% | 4.0% | 1.5% | – | – | 1.14 |
| Texas Tech – 2015 | 93.3% | 6.7% | – | – | – | 1.13 |
| Kansas – 2011 | 94.6% | 5.4% | – | – | – | 1.11 |
| Oklahoma St – 2011 | 95.1% | 4.9% | – | – | – | 1.10 |
| West Virginia – 2015 | 95.3% | 4.7% | – | – | – | 1.09 |
| Kansas State – 2014 | 96.4% | 3.6% | – | – | – | 1.07 |
| Baylor – 2011 | 97.1% | 2.9% | – | – | – | 1.06 |
| West Virginia – 2012 | 97.2% | 2.8% | – | – | – | 1.06 |
| Texas Tech – 2011 | 97.5% | 2.5% | – | – | – | 1.05 |
| Oklahoma – 2011 | 97.6% | 2.4% | – | – | – | 1.05 |
| Kansas State – 2011 | 97.9% | 2.1% | – | – | – | 1.04 |
| Kansas State – 2012 | 98.1% | 1.9% | – | – | – | 1.04 |
| Baylor – 2012 | 98.1% | 1.9% | – | – | – | 1.04 |
| Oklahoma – 2012 | 98.2% | 1.8% | – | – | – | 1.04 |
| Texas A&M – 2011 | 99.3% | 0.7% | – | – | – | 1.01 |
| Missouri – 2011 | 100.0% | – | – | – | – | 1.00 |
Here’s the full chart with every QB listed by name.
A few notes.
• “QB1” in this context does not necessarily mean the QB who started the season – it is the attempts leader for each team during that season. For example, Wes Lunt started the season in 2012, but Chelf had the most attempts that year so he is QB1 in the table.
• The median depth rating was 1.35 in the 50 seasons covered in the table. OSU’s 2015 season was representative of a median QB rotation – QB1 using around 83% of the snaps, QB2 with almost all of the rest.
• OSU’s 2012 QB carousel rates as the deepest a team was forced to go out of the 50 seasons I looked at. 60% of OSU’s attempts in 2012 were used by someone other than the QB1 – the most in this study by a 10% margin. Sure, Baylor used 5 QBs in 2015, but their QB3 used 13% of attempts. In our case, Wes Lunt used 27% of team attempts as the QB3 in 2012.
• OSU had only 1 season in the last 5 that was materially below the conference median – Weeden attempted 95% of OSU’s passes in 2011.
• Who’s had it worst? Iowa State has the highest 5-year average at 1.83 (about on par with the Walsh/Garman/Rudolph season – not fun). Some of that is by choice, of course – just as OSU’s 2015 Walsh package led to a higher score. OSU’s 1.75 average is the 2nd highest in the conference.
• Who’s had it easy? K-State has the lowest 5-year average at 1.16, largely due to having three seasons where their starting QB used 96%+ of team attempts. OU has the 2nd lowest score at 1.28.


Report: Big 12 ADs Have ‘Serious’ Talks about Not Playing Texas Tech Following Sorsby Ruling

Three-Star Offensive Lineman Chase Clark Commits to Oklahoma State

Oklahoma State Flips Three-Star Offensive Lineman Sonny Mullen from Houston

Sorsby’s Temporary Injunction the Latest Example of How Broken College Athletics Is

Parsa Fallah, Kashie Natt Seeking Eligibility Waivers to Play at Oklahoma State Next Season

Oklahoma State’s Top 5 Wins of the Bob Simmons Era

The Reload Ep. 50: Sorsby Ruled Eligible, Will Parsa Fallah Return?

Daily Bullets (June 10): Parsa Fallah Return?
Parsa Fallah, Kashie Natt Seeking Eligibility Waivers to Play at Oklahoma State Next Season

‘Not Enough to Make the NCAA Tournament’: Steve Lutz Is Aiming High This Season
-
 Football2 days ago
Report: Big 12 ADs Have ‘Serious’ Talks about Not Playing Texas Tech Following Sorsby Ruling
-
 Football3 days ago
Three-Star Offensive Lineman Chase Clark Commits to Oklahoma State
-
 Football3 days ago
Oklahoma State Flips Three-Star Offensive Lineman Sonny Mullen from Houston
-
 Football2 days ago
Sorsby’s Temporary Injunction the Latest Example of How Broken College Athletics Is