
Hoops
How far can OSU advance in the NCAA Tournament?
Photo Attribution: USATSI
In Part 1, I answered the question “What seed does OSU deserve?”
In Part 2, I’ll tackle this question: What kind of teams advance in the NCAA tournament?
We know that OSU has is great defensively and average offensively. So what does that mean for us in the Dance? Does defense really win championships or does scoring really matter in March?
Let’s take a look at what kinds of teams have success in the NCAA tournament.
You saw this chart in Part 1:
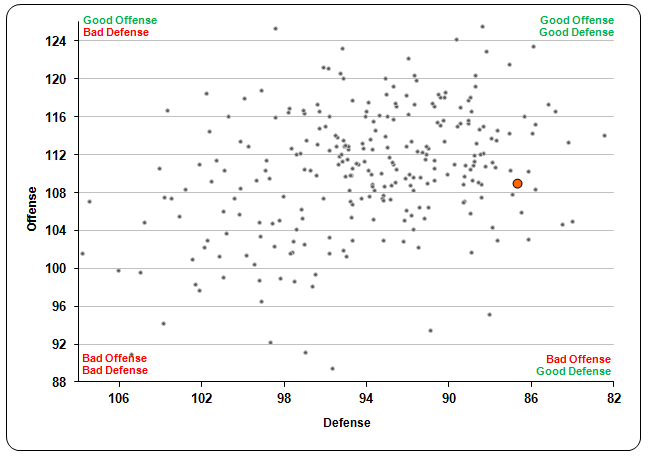
We used it to look at NCAA tournament seedings. This time, we’ll use it to look at how teams advance in the Dance.
Remember, you want to be at the top right. The further “north” you go, the better offense you have. The further “east” you go, the better defense you have.
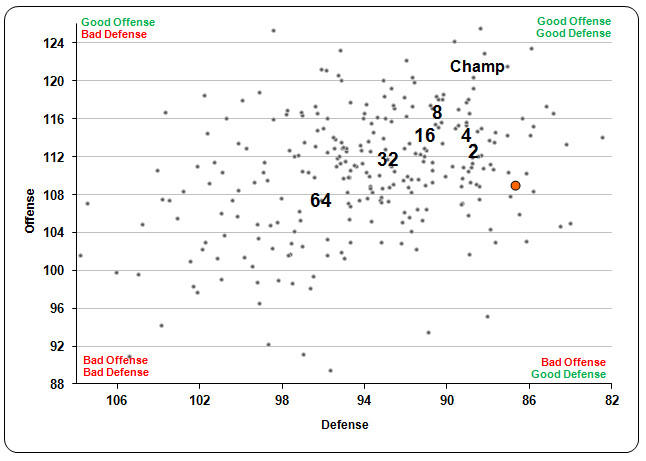
I added some numbers. Here’s the explanation: the “64” is the average chart position for all teams that were eliminated in the 1st round of the dance over the last four years. The “32” is the average chart position for all teams eliminated in the 2nd round, and so on.
In every round of the tournament, teams with better defenses tend to win. The margin between the teams decreases as teams progress, but every round tells the same story — defense wins. The same can be said for offense, although it breaks down once teams reach the Final 4. In all honesty, it’s probably just a small sample size that leads to the strange numbers after the Elite 8. Think about it this way…there are only 4 champions and 4 teams that lost in the title game over this 4-year period, so it’s not hard to throw the average numbers out of whack.
Once again, check out that orange dot for OSU’s current season. We have a championship-level defense and a 1st or 2nd round offense.
Here’s what I think is a little more interesting. What types of teams advance in the tournament?
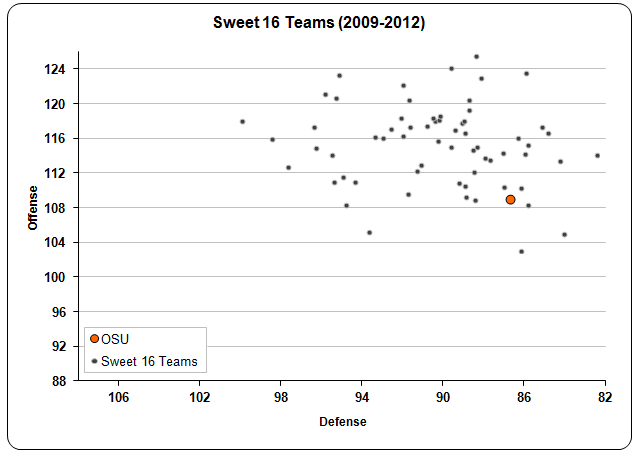
I stripped out all of the teams that were eliminated in the 1st and 2nd rounds over the last four years. All of these teams made it at least to the Sweet 16. I used the same scale as in the chart with all tournament teams to show you that — as you might expect — it tends to be the good offensive and defensive teams that make it this far. Only those in the top right portion of the graph tend to advance.
It’s kind of striking how few outliers advance this far. See the team at around 100 on defense and 118 on offense? They really look like they don’t belong. That’s the 12-seed 2009 Arizona team that beat 5-seed Utah in the first round and then were fortunate to face 13-seed Cleveland State in the 2nd round. They reached the Sweet 16 and were trounced by 1-seed Louisville 103-64. See? They really didn’t belong in the Sweet 16.
If OSU were to make it to the Sweet 16, we would be among the worst offensive teams to advance this far over the last four seasons. Among this group of 64 Sweet 16 teams, only 6 have a lower offensive efficiency score than OSU’s 109.0.
The good news: only 12 teams in this group have a better defensive efficiency score than OSU’s 86.7. If we advance this far, it will be with uncharacteristically good shooting or with the good defense we’ve come to expect out of this team.
Now, on to the group of Final Four teams:
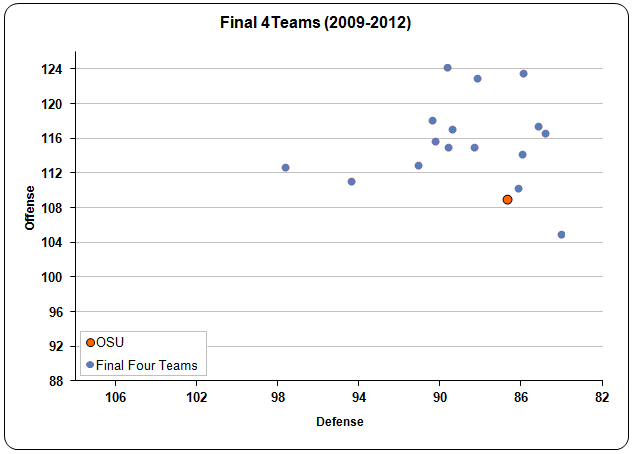
Once again, I used the same scale on the chart. This elite group of 16 teams made the Final 4. Only 1 team in this group had an offense rated worse than OSU’s (Louisville’s 2012 team — which also has the best defense in this group). Six of these teams have a better defense than OSU’s current squad, which shows you just how good you have to be to make it this far.
In case you’re wondering, OSU’s 2004 Final 4 team would be almost directly below that group of three dots at the top of the chart. That team had a defensive rating of 88 and an offensive rating of 120. The 2005 team had an incredible offense (124) but we slipped a little on defense without Tony (92).
Still, while it would be a struggle for OSU to make it to Atlanta, that orange dot doesn’t look completely out of place on this chart, does it? More on this in Part 3.


Report: Big 12 ADs Have ‘Serious’ Talks about Not Playing Texas Tech Following Sorsby Ruling

Sorsby’s Temporary Injunction the Latest Example of How Broken College Athletics Is

Parsa Fallah, Kashie Natt Seeking Eligibility Waivers to Play at Oklahoma State Next Season

A Look at Four of the Prospects Oklahoma State Is Set to Host This Week

‘Not Enough to Make the NCAA Tournament’: Steve Lutz Is Aiming High This Season

Daily Bullets (June 13): Oklahoma AG Speaks out on Texas Tech Case, Steve Lutz and Profile Service

Oklahoma Attorney General Pushes for Big 12 to Suspend Brendan Sorsby, Offers Legal Support

How Oklahoma State’s Best Defenders Stack Up with Big 12
Pistols Firing Podcast Ep. 707: Sorsby Saga and Remembering Bob Simmons

Daily Bullets (June 12): Hoops Conference Opponents Announced
-
 Football5 days ago
Report: Big 12 ADs Have ‘Serious’ Talks about Not Playing Texas Tech Following Sorsby Ruling
-
 Football5 days ago
Sorsby’s Temporary Injunction the Latest Example of How Broken College Athletics Is
-
 Hoops4 days ago
Parsa Fallah, Kashie Natt Seeking Eligibility Waivers to Play at Oklahoma State Next Season
-
 Football4 days ago
A Look at Four of the Prospects Oklahoma State Is Set to Host This Week