
Football
A Look At The Bedlam Drive Charts
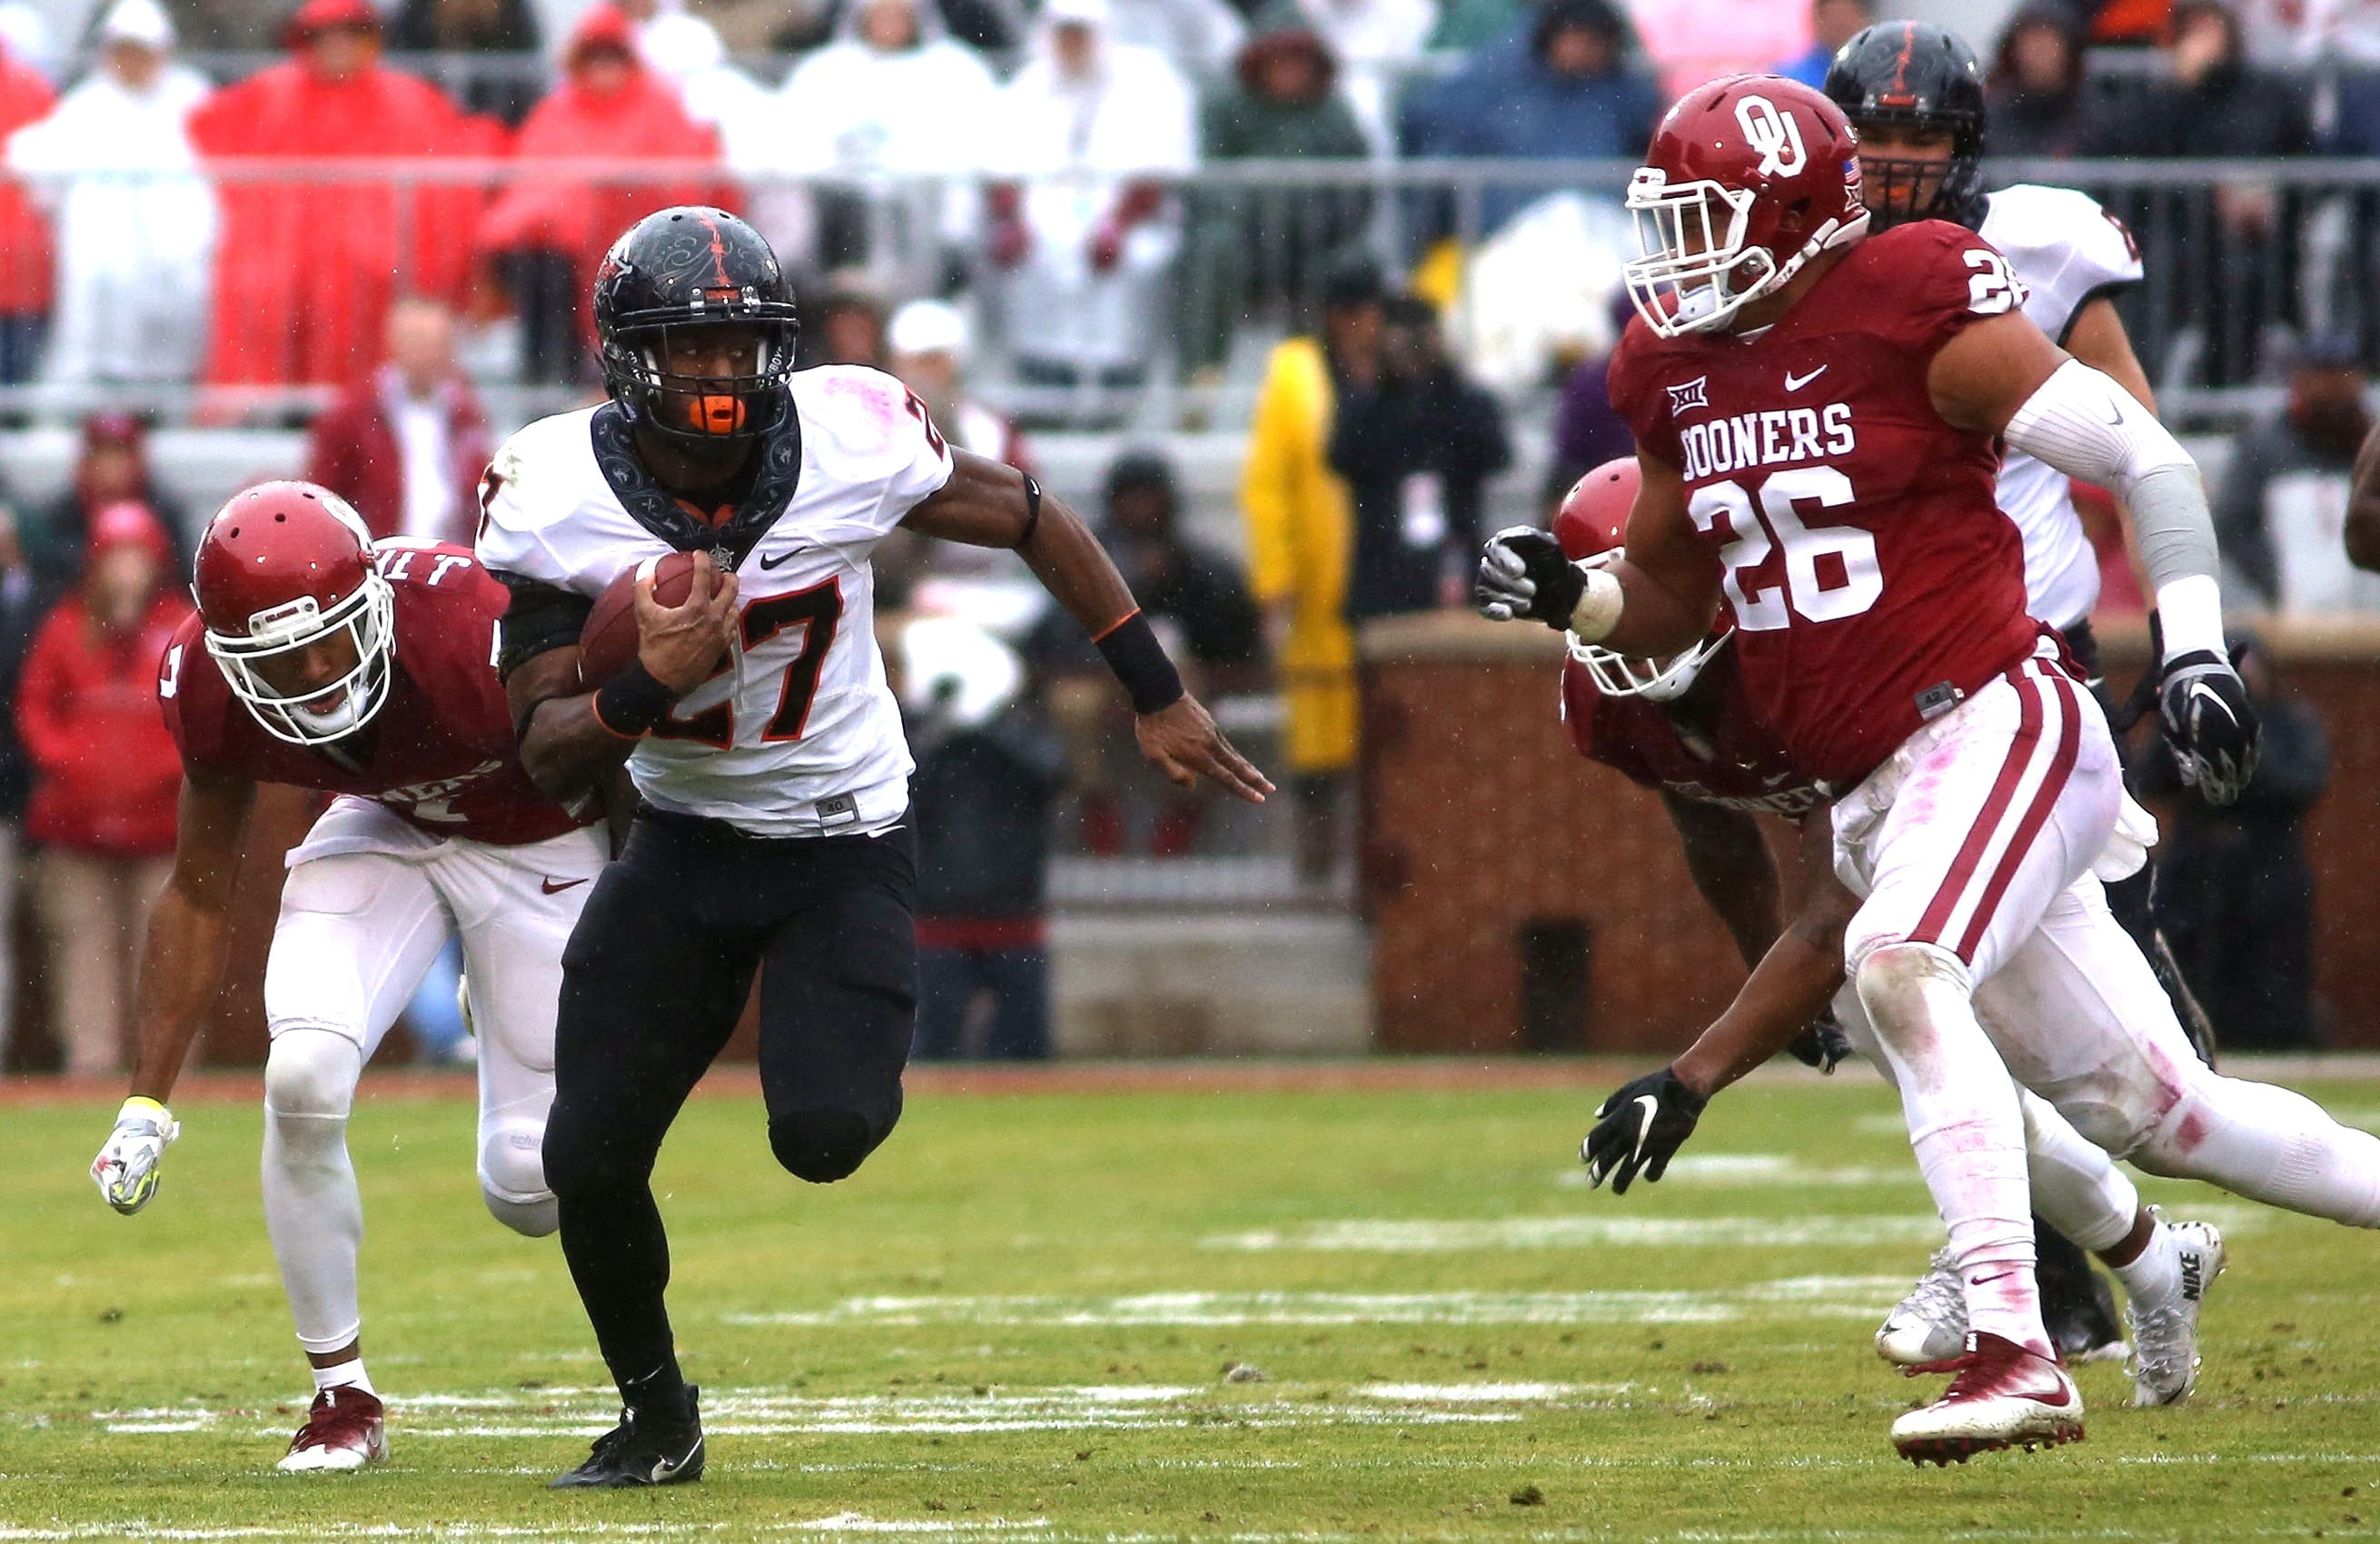
As we wind down looking at Bedlam (thankfully) I wanted to look at the drive charts to see where it went wrong for Oklahoma State. Hide your kids. Hide your wives.
OSU Drive Chart 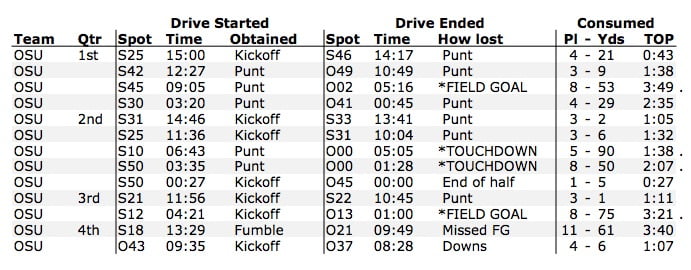
Where did OSU lose the game? How about punting on five of the first six possessions? OU has one of the greatest offenses in Big 12 history. You knew they’d score. You had to get a lead there, and all you could do was get three points. Sad!
- Yards per play: 6.5
- Points per drive (offense): 1.54
- Points per drive (defense): 2.92
- Points off turnovers: 0
- Average starting field position: Own 32
Oklahoma State actually won the field position game big time. It didn’t get points on the only turnover it got, though, and couldn’t put any sustained drives together other than right at the end of the first half.
OU Drive Chart
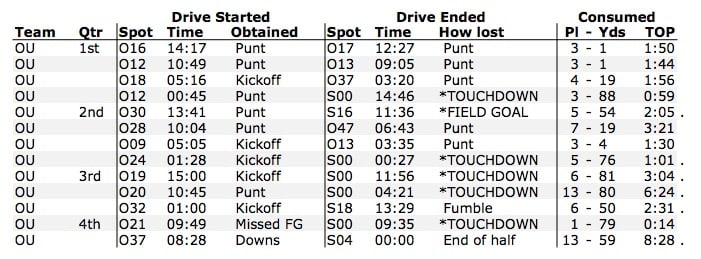
OU essentially ended the game going TD-TD-TD-Fumble-TD-TD because Perine took a knee at the one with a few minutes left. That’s not how you close out a Big 12 title, but again, this game was lost by the offense in the first quarter.
- Yards per play: 8.9
- Points per drive (offense): 2.92
- Points per drive (defense): 1.54
- Points off turnovers: 0
- Average starting field position: Own 21
That 2.92 number looks good because OU averages over 3.4, but if Perine scores it jumps to 3.46 so it’s really not all that impressive. Making them start on their own 21 was, though. #Sinor4Heisman. Also, how about those final six drives for OU? All over 50 yards, four (should have been five) TDs. Whoooo boy, Lincoln Riley gonna get paid.


Roundtable Mailbag: Position Group Power Rankings, Will Mestemaker Be a First Round Pick?

Oklahoma State Lands Three-Star 2027 OL Jake Baker

Daily Bullets (June 15): Pokes Add Southeastern Lineman, Eric Morris Among Peers

Three-Star Safety Chayce Davis Commits to Oklahoma State

OSU Baseball: Morehead State Transfer Aubrey Kearns Commits to Cowboys

Daily Bullets (June 19): (Former) Cowboy Leads at US Open, Pokes Lock in New Opponent at GIA

Oklahoma State Quarterback Drew Mestemaker to Attend Manning Passing Academy

Former OSU Offensive Line Commit Chase Clark Flips to Purdue

Cowboy Hoops: Oklahoma State to Host Saint Mary’s This Season

The Reload Ep. 51: Mailbag Episode, Discussing Sorsby, the Future of Diamond Sports and More
-
 Football4 days ago
Roundtable Mailbag: Position Group Power Rankings, Will Mestemaker Be a First Round Pick?
-
 Football4 days ago
Oklahoma State Lands Three-Star 2027 OL Jake Baker
-
 Daily Bullets4 days ago
Daily Bullets (June 15): Pokes Add Southeastern Lineman, Eric Morris Among Peers
-
 Football3 days ago
Three-Star Safety Chayce Davis Commits to Oklahoma State