
Football
A Look At The Oklahoma State-Kansas Drive Charts
Drive charts and points scored per drive might just bore you right to tears, but I find this stuff fascinating. It matters because you can look at drive charts and PPD and determine “could that team score when it needed to, and could it get stops when it needed to.”
So let’s look at the two drive charts from Saturday’s game against Kansas and a few other deep statistics that mattered.
OSU Drive Chart
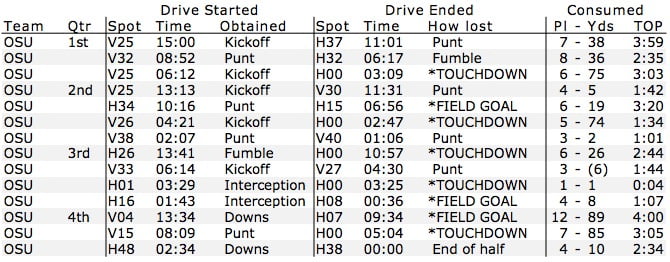
This started off pretty poorly. OSU went punt, fumble, TD and punt in its first four drives against one of the worst teams in FBS. The Pokes closed strong though with scores on five of their last six real drives. Other key numbers to know.
- Yards per play: 6.6
- Points per drive (offense): 3.14
- Points per drive (defense): 1.43
- Points off turnovers: 17
- Average starting field position: Own 42
You should be averaging over seven yards per play against KU. The PPD numbers are fine, but OSU’s offense was greatly aided turnovers that it got in great position (three times inside KU’s 30 in the second half).
Kansas Drive Chart
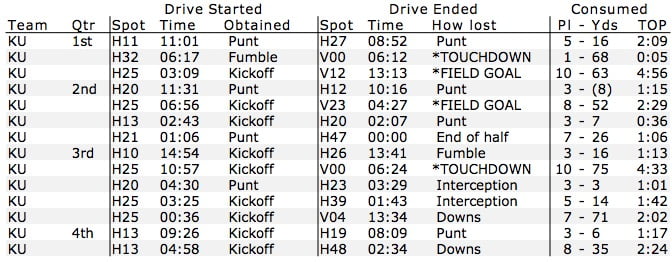
Kansas actually started off nicely with scores on three of its first five possessions. But then it was held to seven points on its next nine drives. That’s not going to get it done (obviously). A few other numbers …
- Yards per play: 6.2
- Points per drive (offense): 1.43
- Points per drive (defense): 3.14
- Points off turnovers: 7
- Average starting field position: Own 19
That average starting field position is something else. Nobody is going to win many games starting on their own 19 on average, much less Kansas.
Also a note on that yards-per-play number: OSU is now No. 118 in the country in plays allowed of 30+ yards. Texas Tech and OU are both top five in the country in plays of 30+ yards on offense. Gulp.


Four-Star Quarterback Adam Schobel Commits to Oklahoma State, Flips from Baylor

‘Keep Turning Over the Rocks’: Looking at the Portal Landscape as Lutz Looks to Solidify His First OSU Roster

Four-Star Signee Jeremiah Johnson Reaffirms Commitment to Oklahoma State after Coaching Change

Daily Bullets (Apr. 23): Pokes Land Four-Star Quarterback, Retain Talent from Mike Boynton Era

The Top 5 Quotes from Mike Gundy’s Final Spring Practice News Conference

PFB+ Q&A: Robert Jennings II Discusses Oklahoma State Commitment
Podcast Ep. 581: Lutz Building Roster

Daily Bullets (Apr. 26): Lutz Adds Another Player, Looking at OSU’s QB Commit

OSU Baseball: Cowboys Rout BYU 17-5 Behind Six Home Runs

Texas Tech Transfer Robert Jennings Commits to Oklahoma State
-
 Football4 days ago
Four-Star Quarterback Adam Schobel Commits to Oklahoma State, Flips from Baylor
-
 Hoops4 days ago
‘Keep Turning Over the Rocks’: Looking at the Portal Landscape as Lutz Looks to Solidify His First OSU Roster
-
 Hoops4 days ago
Four-Star Signee Jeremiah Johnson Reaffirms Commitment to Oklahoma State after Coaching Change
-
 Daily Bullets3 days ago
Daily Bullets (Apr. 23): Pokes Land Four-Star Quarterback, Retain Talent from Mike Boynton Era