
Hoops
Oklahoma State Basketball Efficiency Ratings

Photo Attribution: US Presswire
OKC Dave is our statistician extraordinaire. He posts often (and intelligently) on OSU football and hoops.
Marcus Smart certainly passes the eye test, but I wondered how he stacked up against former OSU players statistically — and what that might mean for this basketball team.
I calculated the efficiency rating for each player in the Sutton/Ford era. A player’s efficiency rating is easy to calculate from a box score:
[(Points + Rebounds + Assists + Steals + Blocks – FG missed – FT missed – Turnovers) / Game]
It’s not perfect, but it’s a quick and easy way to put together everything a player does on the court that can be recorded. You should know that it is biased towards big men because it rewards a higher shooting percentage and they typically are able to grab rebounds easier than guards.
To get an idea of what a “good” efficiency rating is, here’s a list of the top 3 players in efficiency rating in the Sutton/Ford era, excluding this season.
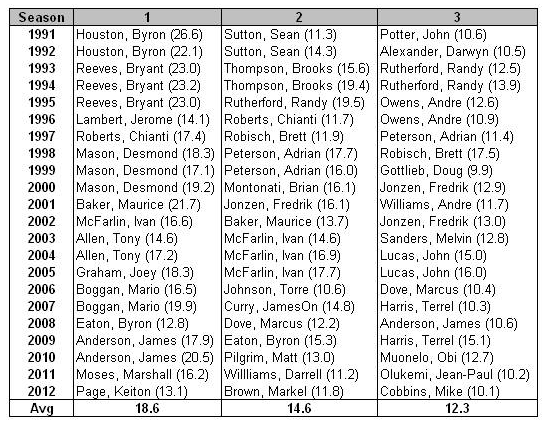
The average leading efficiency rating in the Sutton/Ford era is 18.6. If you add up the top 3 players each year, the average is 45.5.
Here’s where it gets interesting. In years where OSU made the NCAA Tournament, the average for the top player is 20.0. The average of the top 3 players in those seasons is 48.9. In seasons where OSU did not make the dance, the average for the top player is 15.7. The average for the top 3 players in those seasons is 38.3.
So how do the 2013 Cowboys stack up? Smart currently has an efficiency rating of 18.5, which is just about average for the top player in each season – but it’s worth noting that he is well above average if you take out the Houston/Reeves seasons. 18.5 would be 5th-highest total in the post-Reeves era, behind only Baker, JA, Boggan, and Mason.
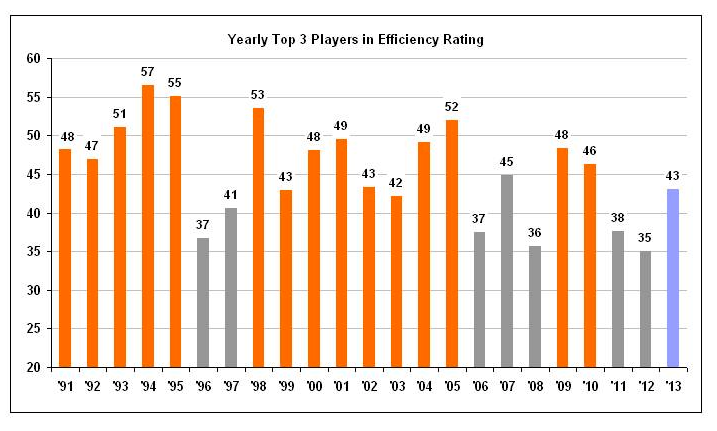
How about the top 3 this year? They are Smart (18.5), Brown (13.7), and Nash (10.8). Add them up and you get 43.0. This is…well…not very good. It would be 15th among the 23 seasons in the Sutton/Ford era. It is just about halfway between the tournament-season average and the NIT-season average. To put it simply…Smart needs some help. Here’s a chart showing the top 3 leaders in efficiency rating by season. Years OSU made the dance are highlighted in orange.
Our current team reminds me a lot of the 2002 and 2003 teams that finished in the top third of the Big 12 and made the tournament. Those teams didn’t have the best talent in the conference, but they played extremely hard and gutted out several close games with defensive stops and (gulp) excellent coaching. I hope this 2013 team can replicate that formula.


Oklahoma State’s Top 5 Wins of the Bob Simmons Era

Three-Star Texas Wide Receiver Ake O’Neal Commits to Oklahoma State

Cowboy Hoops: Big 12 Releases Oklahoma State’s Conference Pairings for 2026-27 Season

Steve Lutz Leaned More Heavily on Personality Test When Constructing Oklahoma State’s Roster

OSU Softball: Houston Two-Way Transfer Madison Hartley Commits to Oklahoma State

Oklahoma State Lands Three-Star 2027 OL Jake Baker

Daily Bullets (June 14): Kenny Gajewski, Josh Holliday Each Land Big 12 Transfers on Saturday

OSU Baseball: Utah Transfer Pitcher Kaden Soder Commits to Oklahoma State
OSU Softball: Houston Two-Way Transfer Madison Hartley Commits to Oklahoma State

OSU Softball: Utah Transfer Catcher Kennedy Proctor Commits to Oklahoma State
-
 Football5 days ago
Oklahoma State’s Top 5 Wins of the Bob Simmons Era
-
 Football4 days ago
Three-Star Texas Wide Receiver Ake O’Neal Commits to Oklahoma State
-
 Hoops4 days ago
Cowboy Hoops: Big 12 Releases Oklahoma State’s Conference Pairings for 2026-27 Season
-
 Hoops3 days ago
Steve Lutz Leaned More Heavily on Personality Test When Constructing Oklahoma State’s Roster