
Football
Oklahoma State Is Not Scoring Enough TDs In The Red Zone
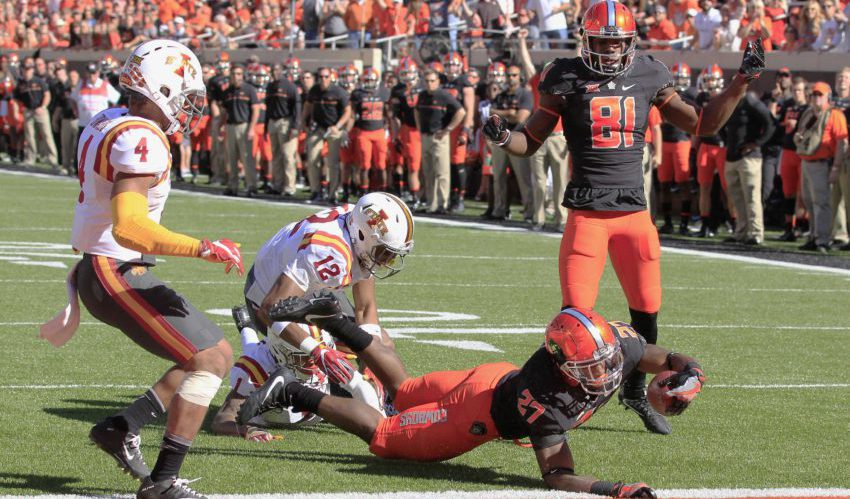
Coming into 2016 we knew this was the year. Mason Rudolph would finally get his chance to shine. No longer would he have to look over his shoulder when the Cowboys were in a short-yardage or red-zone situation.
That has been the case. There is no QB2 taking snaps from him other than in “garbage time” and Rudolph has been very good this year as the leader of the offense.
But J.W. Walsh’s most tangible strength was his effectiveness in the red zone and the Cowboys have taken an obvious step back after his departure. Let’s take a look at the numbers.
Here are the scoring percentage numbers for the last few years. This accounts for the times when the Cowboys made it into the red zone and did not come away empty handed.
- 2016 – 86.96 percent – No. 6 in Big 12 – No. 46 nationally
- 2015 – 91.67 percent – No. 2 in Big 12 – No. 9 nationally
- 2014 – 90.48 percent – No. 1 in Big 12 – No. 13 nationally
- 2013 – 87.50 percent – No. 5 in Big 12 – No. 27 nationally
- 2012 – 93.06 percent – No. 2 in Big 12 – No. 4 nationally
- 2011 – 89.02 percent – No. 3 in Big 12 – No. 14 nationally
- 2010 – 95.08 percent – No. 1 in Big 12 – No. 1 nationally
- 2009 – 84.09 percent – No. 5 in Big 12 – No. 43 nationally
- 2008 – 89.47 percent – No. 3 in Big 12 – No. 17 nationally
So far through eight games the Cowboys rank sixth in the Big 12 and 46th nationally with a 86.96 scoring percentage. That’s down from last year’s 91.67 percent which was second in the conference and ninth nationally. It’s also the lowest red-zone scoring percentage since 2009 (84.09 percent).
But this only tells part of the story. There is only a 2.06 percent difference between this year’s team (to date) and the 2011 team which we would all consider the benchmark for offensive efficiency at OSU. That 2011 team averaged 6.31 red-zone attempts per game compared to this year’s 4.75. Obviously the more times you make it into the red zone, the more opportunities to score.
But the biggest difference is not just scoring in the red zone, it’s whether you score three points or six. We’ll exclude extra point and two-point conversion attempts since they are not related to the subject at hand.
Let’s look at touchdown percentage, the percentage of red-zone visits that result in a touchdown as compared to a field goal.
- 2016 – 58.70 percent – No. 7 in Big 12 – No. 78 nationally
- 2015 – 66.67 percent – T3 in Big 12 – No. 26 nationally
- 2014 – 50.00 percent – No. 10 in Big 12 – No. 109 nationally
- 2013 – 75.00 percent – No. 1 in Big 12 – No. 8 nationally
- 2012 – 66.67 percent – No. 4 in Big 12 – No. 26 nationally
- 2011 – 64.63 percent – No. 7 in Big 12 – No. 37 nationally
- 2010 – 67.21 percent – No. 3 in Big 12 – No. 25 nationally
- 2009 – 63.64 percent – No. 5 in Big 12 – No. 34 nationally
- 2008 – 68.42 percent – T7 in Big 12 – No. 22 nationally
Based on this stat, the 2013 team was by far the best at getting six points when they got to the red zone. This year has been bad. 2014 was really bad. This offers a better representation than just scoring percentage in the first stat as 2014 was the worst offense OSU has had in recent memory. The 2016 team is second-worst behind that 2014 team.
There’s a stat that we like to use around here called “points per drive.” It’s one of the better out there at telling how efficient an offense is.
So I took that idea and applied it just to red-zone attempts. How many points do you get per red-zone trip.
Of course, there are other variables to consider like “garbage time” and the point margin at certain times of a game which could affect whether or not a team attempts a field goal on fourth down or tries for a touchdown. But for our purposes we’ll just go with “points per red-zone attempt.”
Here’s how OSU has looked over the years.
- 2016 – 4.37 ppr
- 2015 – 4.75 ppr*
- 2014 – 4.21 ppr
- 2013 – 4.86 ppr*
- 2012 – 4.79 ppr*
- 2011 – 4.61 ppr
- 2010 – 4.87 ppr
- 2009 – 4.43 ppr
- 2008 – 4.74 ppr
So 2015, 2013, 2012 and 2010 were really good. Last year’s success can be mostly attributed to the “Walsh package.” The other teams just had better traditional running games and/or more effective goal-line options/packages.
*Walsh had his finger print on 2013 and 2012, as well.
This year’s team is the second-worst in the last nine years at Oklahoma State in “ppr” thus far. The Cowboys aren’t having trouble putting up points this year. They’re averaging 40.6 points per game which is 15th in the nation and the highest since 2012.
And things like turnovers in the red-zone can negatively affect that number, as well. The Cowboys have had a couple of those this year. Also too many field goals will make this number sag.
While we have seen improvements in the running game, we can also see that the Cowboys still have some room to improve when it comes to the score zone. This like all stats has to be looked at in the context of several others but I think it accurately illustrates one of the Cowboys’ offensive deficiencies.


Oklahoma State’s Top 5 Wins of the Bob Simmons Era

Three-Star Texas Wide Receiver Ake O’Neal Commits to Oklahoma State

Cowboy Hoops: Big 12 Releases Oklahoma State’s Conference Pairings for 2026-27 Season

Steve Lutz Leaned More Heavily on Personality Test When Constructing Oklahoma State’s Roster

OSU Softball: Houston Two-Way Transfer Madison Hartley Commits to Oklahoma State

Oklahoma State Lands Three-Star 2027 OL Jake Baker

Daily Bullets (June 14): Kenny Gajewski, Josh Holliday Each Land Big 12 Transfers on Saturday

OSU Baseball: Utah Transfer Pitcher Kaden Soder Commits to Oklahoma State
OSU Softball: Houston Two-Way Transfer Madison Hartley Commits to Oklahoma State

OSU Softball: Utah Transfer Catcher Kennedy Proctor Commits to Oklahoma State
-
 Football4 days ago
Oklahoma State’s Top 5 Wins of the Bob Simmons Era
-
 Football3 days ago
Three-Star Texas Wide Receiver Ake O’Neal Commits to Oklahoma State
-
 Hoops3 days ago
Cowboy Hoops: Big 12 Releases Oklahoma State’s Conference Pairings for 2026-27 Season
-
 Hoops3 days ago
Steve Lutz Leaned More Heavily on Personality Test When Constructing Oklahoma State’s Roster