
Football
The Oklahoma State-TCU Drive Charts Are Beautiful
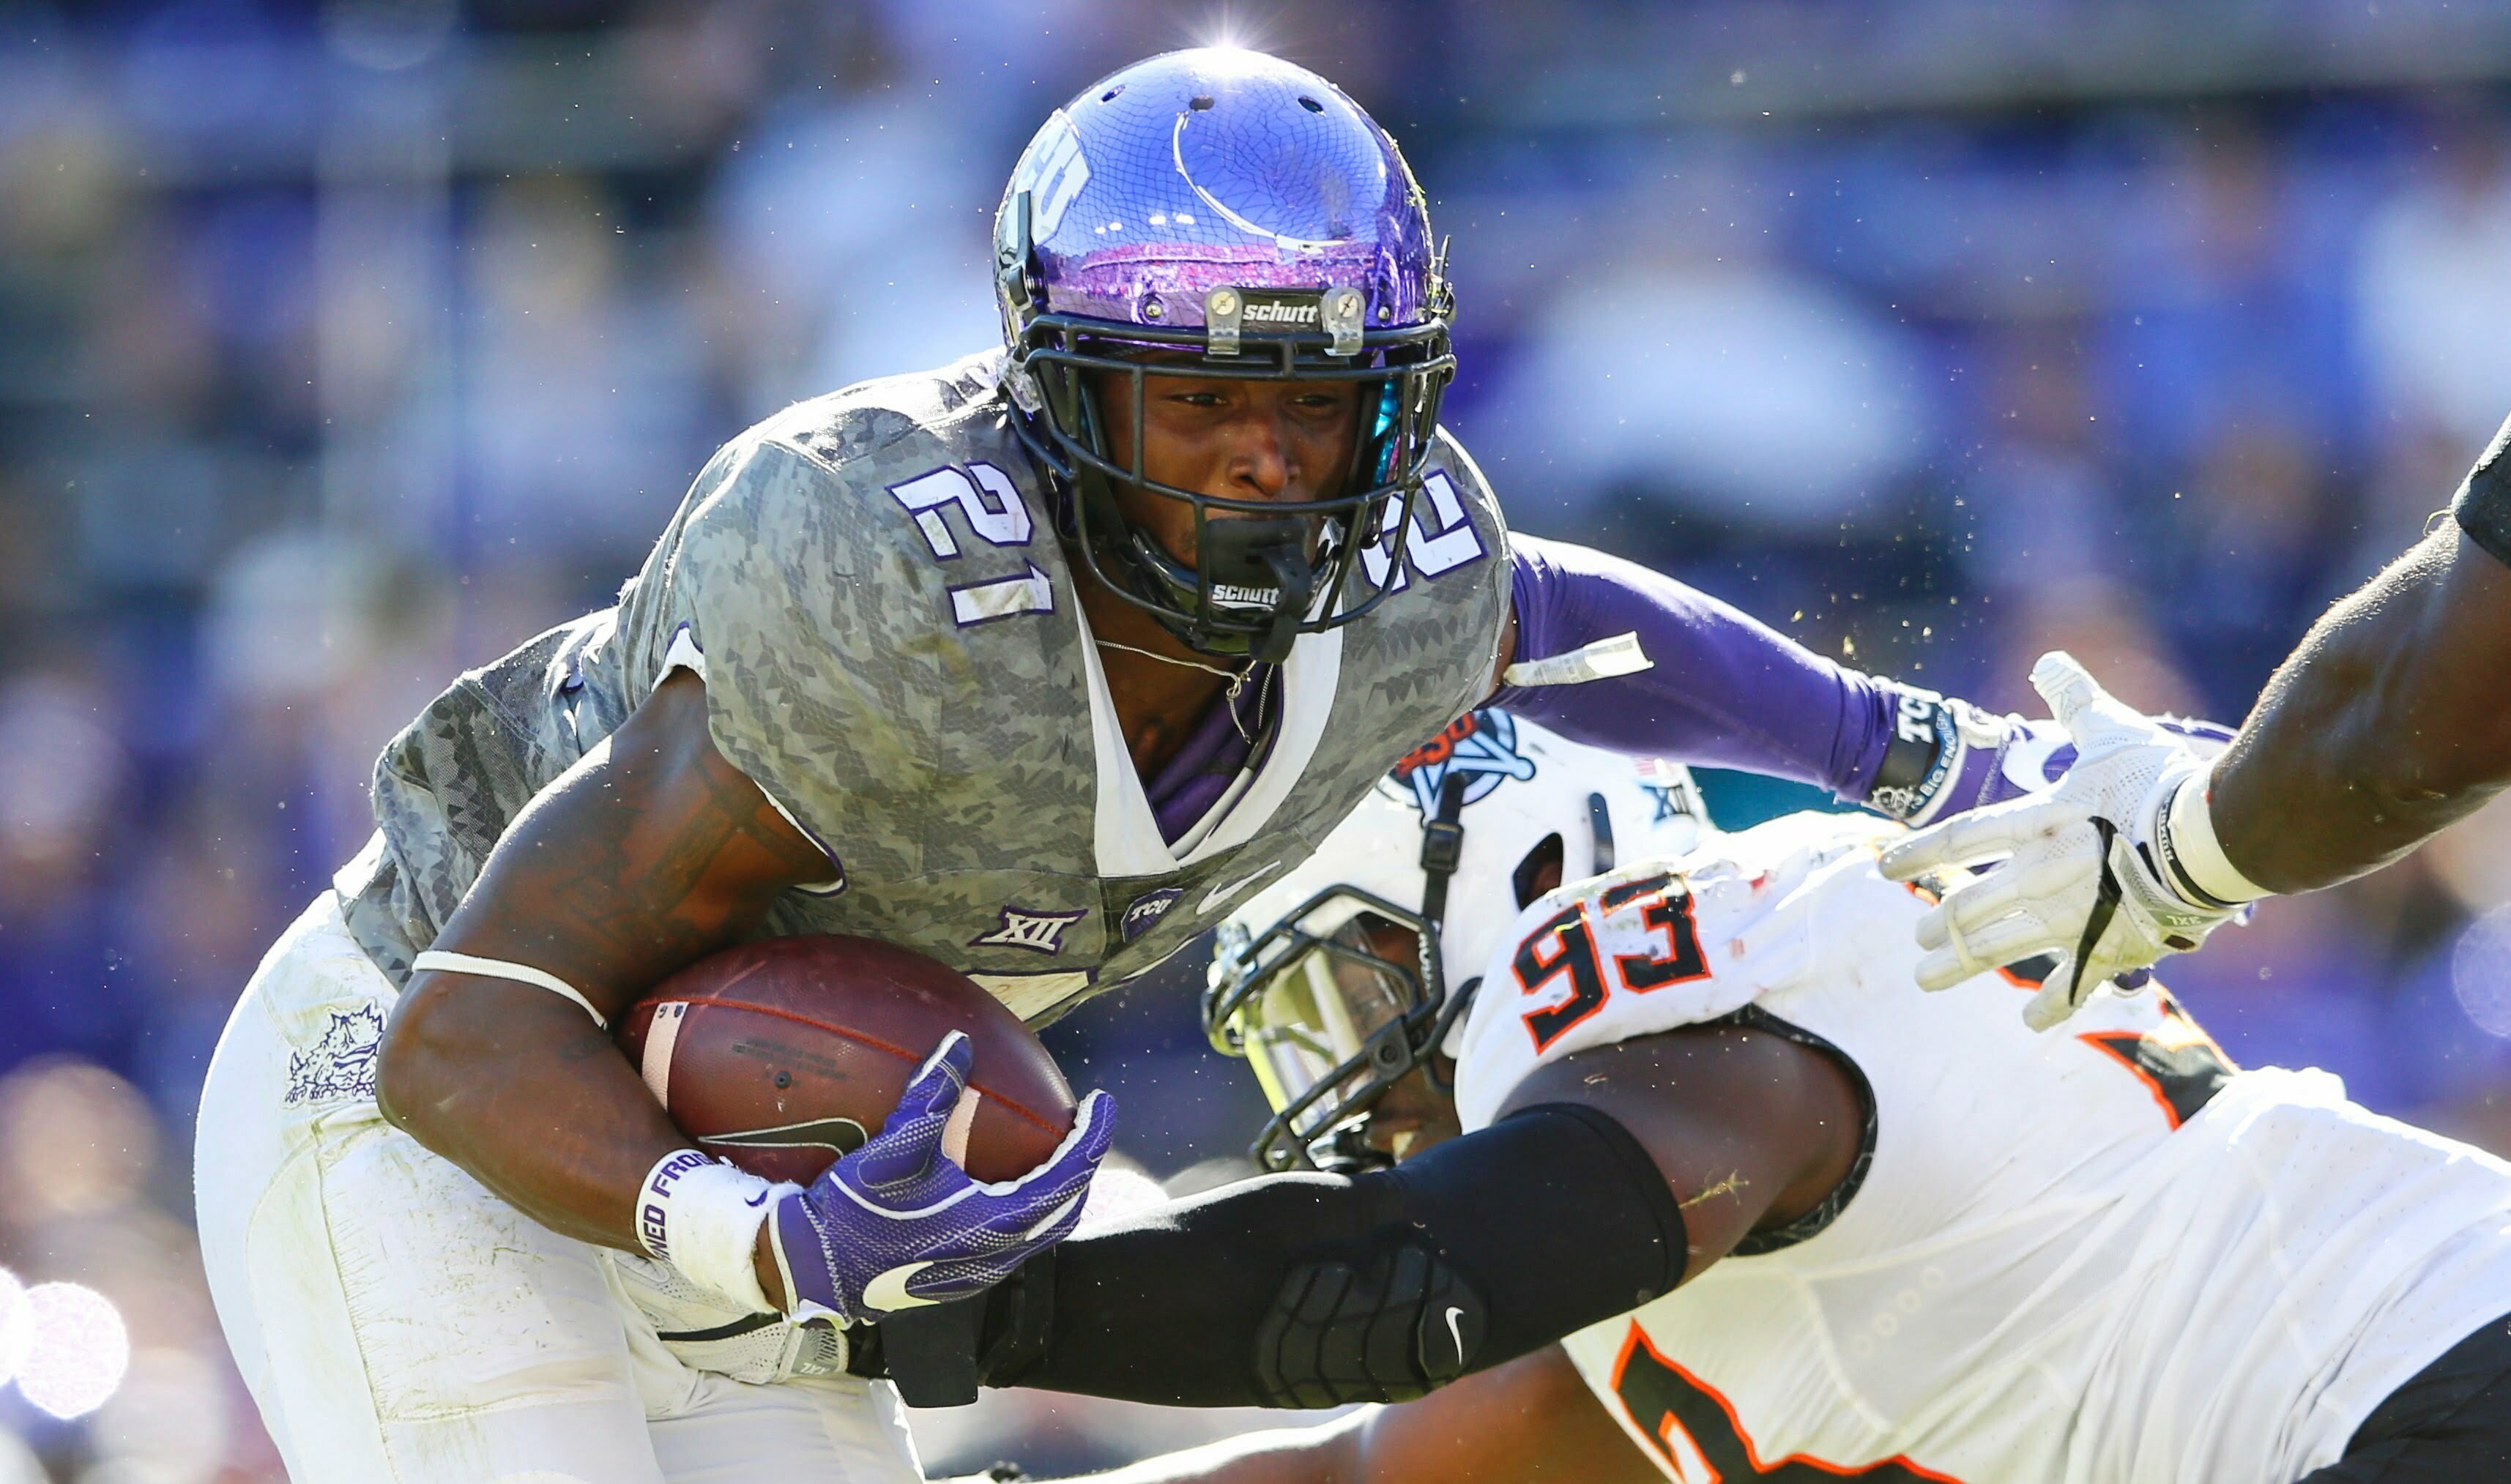
Oklahoma State pounded TCU on Saturday 31-6, and the drive charts from the game are everything you would imagine and maybe even more. Let’s take a look at Mike Yurcich’s offense first.
OSU Drive Chart
That second-half offense clutched up after a pretty weak first half. Here are the advanced stats:
- Yards per play: 6.8
- Points per drive (offense): 2.82
- Points per drive (defense): 0.50
- Points off turnovers: 7
- Average starting field position: Own 25
OSU almost reached the seven-yards-a-play mark for the third straight game. That 2.82 number on offense is good, not great. It would look a lot better if they had scored one more TD on the final drive of the game.
TCU Drive Chart

- Yards per play: 4.8
- Points per drive (offense): 0.50
- Points per drive (defense): 2.82
- Points off turnovers: 6
- Average starting field position: Own 25
Glenn Spencer is going to hand out TCU’s drive chart from this game as a stocking stuffer for Christmas because this is the most beautiful thing I have ever seen. How about 0.50 points per drive?! How about six punts, two picks, three TOs on downs and just one TD? How about 4.8 yards per play for an offense that came in averaging nearly seven.
Spencer said after the game he was thrilled for his guys, and he should be. That was one of the great defensive performances of the Mike Gundy era.
“Just happy the guys can get recognized for that,” Spencer told the Oklahoman. “Somebody’s going to say something good about ’em this week. I get tired of people talking bad about them.”
Here are the 10 instances in the Gundy era when OSU has held a team to six or fewer points and five or fewer yards per play. It’s just the fifth time against a FBS opponent.


Oklahoma State’s Top 5 Wins of the Bob Simmons Era

Three-Star Texas Wide Receiver Ake O’Neal Commits to Oklahoma State

Cowboy Hoops: Big 12 Releases Oklahoma State’s Conference Pairings for 2026-27 Season

Steve Lutz Leaned More Heavily on Personality Test When Constructing Oklahoma State’s Roster

OSU Softball: Houston Two-Way Transfer Madison Hartley Commits to Oklahoma State

Oklahoma State Lands Three-Star 2027 OL Jake Baker

Daily Bullets (June 14): Kenny Gajewski, Josh Holliday Each Land Big 12 Transfers on Saturday

OSU Baseball: Utah Transfer Pitcher Kaden Soder Commits to Oklahoma State
OSU Softball: Houston Two-Way Transfer Madison Hartley Commits to Oklahoma State

OSU Softball: Utah Transfer Catcher Kennedy Proctor Commits to Oklahoma State
-
 Football4 days ago
Oklahoma State’s Top 5 Wins of the Bob Simmons Era
-
 Football3 days ago
Three-Star Texas Wide Receiver Ake O’Neal Commits to Oklahoma State
-
 Hoops3 days ago
Cowboy Hoops: Big 12 Releases Oklahoma State’s Conference Pairings for 2026-27 Season
-
 Hoops3 days ago
Steve Lutz Leaned More Heavily on Personality Test When Constructing Oklahoma State’s Roster