
Feature
The One Stat That Has to Change If OSU Is Going to Be Successful in 2015
I was doing a little research for the 2015 season recently, and I stumbled upon a pretty interesting stat and corresponding correlation. The appropriately-named fbsdrivestats.com has drive charts for every FBS school in the country dating back to 2005 which is incredible. I started digging in and found something that intrigued me in this chart.
This shows what percentage of possible yards OSU gave up on drives in a given season (black dots) and what percentage of possible yards OSU gained on drives in a given season (orange dots). So if your offense starts on its own 20 and scores a TD, that would be 100 percent of yards gained. It it gets to the opposing team’s 20 that would be 60 yards gained out of a possible 80, or 75 percent. You obviously want the orange dot to be higher than the black.
The orange and black numbers are how many wins OSU had each season.
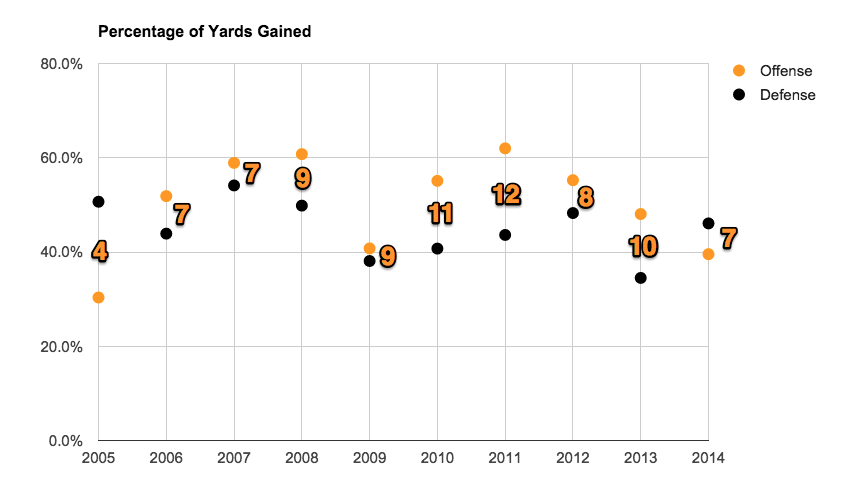 As one would expect, Mike Gundy’s first year in 2005 (far left) was an abomination. OSU gained 30 percent of possible yards on every drive. So if it started every drive at its own 20 it advanced, on average, to the other team’s 46. That’s not good. It also gave up over 50 percent (!) of total possible yards.
You can see why that team went 4-7.
But 2015 wasn’t a whole lot better. OSU gained only 40 percent of possible yards on a given drive and gave up 46 percent. You can see why that team went 7-6. Obviously 2010-11 are the gold standards. In 2011, OSU gained 62 percent of possible yards on a given drive and only surrendered 44 percent. A joke, really. Incredible.
If the Pokes reverse last year’s numbers they should have a 9-win or even 10-win season. Basically, 2012 without the QB-go-round.


Oklahoma State Wins All-Sports Bedlam for Sixth Time in Last Seven Years

Three-Star Running Back TJ Lewis Commits to Oklahoma State

Report: Kashie Natt Files Lawsuit Against NCAA Seeking Eligibility

Viktor Hovland Outlasts Scottie Scheffler to Win Traveler’s Championship

Fixing the Group of Five: A Fun Idea to Bring Promotion-Relegation to College Football

Steve Lutz Releases Statement on Kashie Natt’s Eligibility Pursuit

Player Rating Superlatives: A Look at the Fastest, Strongest Cowboys in EA Sports’ College Football 27

Eric Morris’ Coaching Staff Has More in Common with Contenders than Big 12 Newcomers

Daily Bullets (July 1): Caleb Hawkins a (Preseason) All-American

Oklahoma State Running Back Caleb Hawkins Named Walter Camp Preseason All-American
-
 Baseball2 days ago
Oklahoma State Wins All-Sports Bedlam for Sixth Time in Last Seven Years
-
 Football5 days ago
Three-Star Running Back TJ Lewis Commits to Oklahoma State
-
 Hoops2 days ago
Report: Kashie Natt Files Lawsuit Against NCAA Seeking Eligibility
-
 Golf2 days ago
Viktor Hovland Outlasts Scottie Scheffler to Win Traveler’s Championship