
Football
The Seven Best (and Worst) Stats From Bedlam
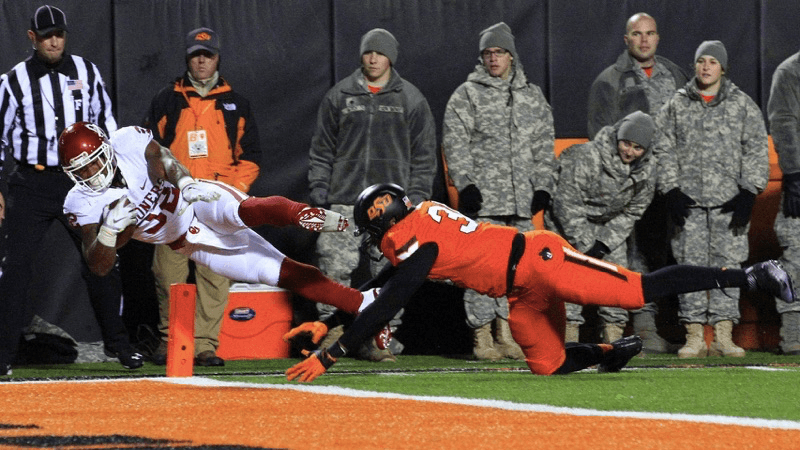
We have to do it, guys. We have to look at some egregious numbers from Bedlam. I’ll make it short and sweet and then we’ll move on to next week and the bowl game. Here we go.
1. OU averaged 4.25 points per drive
Holy balls! That’s 51 points on 12 drives. Up to this point in the season, I believe OSU had held every team it had faced to under its season average in points per drive on offense. OU came in averaging 3.08.
2. Home advantage?
Three home games in November sounds great until you lose two of them.
This will be the first time since 2009-10 that #okstate has lost multiple games at home back-to-back years.
— Nathan Ruiz (@NathanSRuiz) November 29, 2015
3. J.W. Walsh slings it
J.W. Walsh threw as many passes in the first half on Saturday (29) as he had thrown all season. That’s not ideal.
Also, now only Brandon Weeden (16) has more 300-yard passing games in Oklahoma State school history than J.W. Walsh (6). Mason Rudolph also has six. That’s pretty wild though.
4. James Washington joins the 1,000-yard receiver club.
I wrote about this a little here, but here are the other 1,000-yard receivers in school history:
Adarius Bowman (2x)
Justin Blackmon (2x)
Hart Lee Dykes (2x)
Rashaun Woods (3x)
Dez Bryant
Josh Stewart
James Washington
That’s the entire list.
Also, Washington leads the country in TD receptions over 70 yards. You could make a decent case that he’s the best deep threat in the country.
5. Emmanuel Ogbah gets his 13th sack
Best sack seasons ever in OSU history:
Leslie O’Neal — 16
Gary Lewis — 14
Emmanuel Ogbah — 13
6. That first half …
OU’s 44 first-half points were the most they had scored in a Bedlam half since 1970, when they put up 45 before halftime on the way to a 66-6 win. (via ESPN)
7. Ground attack is not pretty
OSU rush yards the last two weeks: 140
OSU opponent rush yards the last two weeks: 648
[side eyes emoji]


Parsa Fallah, Kashie Natt Seeking Eligibility Waivers to Play at Oklahoma State Next Season

A Look at Four of the Prospects Oklahoma State Is Set to Host This Week

‘Not Enough to Make the NCAA Tournament’: Steve Lutz Is Aiming High This Season

Oklahoma State’s Top 5 Wins of the Bob Simmons Era

Three-Star Texas Wide Receiver Ake O’Neal Commits to Oklahoma State

OSU Softball: Utah Transfer Catcher Kennedy Proctor Commits to Oklahoma State

Daily Bullets (June 13): Oklahoma AG Speaks out on Texas Tech Case, Steve Lutz and Profile Service

Oklahoma Attorney General Pushes for Big 12 to Suspend Brendan Sorsby, Offers Legal Support

How Oklahoma State’s Best Defenders Stack Up with Big 12
Pistols Firing Podcast Ep. 707: Sorsby Saga and Remembering Bob Simmons
-
 Hoops4 days ago
Parsa Fallah, Kashie Natt Seeking Eligibility Waivers to Play at Oklahoma State Next Season
-
 Football4 days ago
A Look at Four of the Prospects Oklahoma State Is Set to Host This Week
-
 Hoops4 days ago
‘Not Enough to Make the NCAA Tournament’: Steve Lutz Is Aiming High This Season
-
 Football3 days ago
Oklahoma State’s Top 5 Wins of the Bob Simmons Era